Lake Norman Real Estate Market Update November 2016
Lake Norman Homes
In November 129 homes sold in the Lake Norman area, a 5.8% decrease from the 137 homes sold in October but the highest November total since 2005! The November 2016 sales figures increased 20.6% from November 2015 when 107 homes sold in the Lake Norman area.
The average sales price increased .9% from $485,240 in October to $489,416 in November. The November 2016 average sales price increased 8.4% from the November 2015 average sales price which was $451,641.
Average days on the market increased 7.9% from 76 days on the market in October to 82 days on the market in November. The November 2015 average days on the market were 72, a 13.9% increase in market time.
Currently there are 802 active homes for sale in the Lake Norman MLS area, down 7.2% from November. The average list price is $714,324 down 4.1% from the November average list price of $744,596. The average days on the market are 236. 244 Lake Norman homes are currently under contract, down 20% from November. Based on this data we are currently in a balanced market, 6.2 months of inventory, in the Lake Norman area.
Stay up to date on the Lake Norman real estate market with our FREE market updates:LakeNormanHomePrices.com
Lake Norman Condos & Townhomes
In November 40 condos/townhomes sold in the Lake Norman area, a 29% increase from the 31 condos or townhomes sold in October and the highest total condos sold in November on record. November 2016 sales figures increased 73.9% from November 2015 when 23 Lake Norman condos sold.
The average sales price increased 10.8% from $215,834 in October to $239,094 in November. The November 2016 average sales price increased 14.4% from the November 2015 average sales price which was $209,020.
Average days on the market decreased 42.9% from 63 in October to 36 in November. The November 2015 average days on the market were 56, a 35.7% decrease in market time.
Currently there are 40 active condo/townhome listings for sale in the Lake Norman MLS area, a 15% decrease from the 47 condos for sale in November. The average list price is $278,620, down 2.9% from November’s average list price of $286,849. The average days on the market are 100. 20 Lake Norman condos/townhomes are currently under contract, a 44% decrease from November.
Stay up to date on the Lake Norman real estate market with our FREE market updates:LakeNormanHomePrices.com
Lake Norman Lots
In November 34 lots sold in the Lake Norman area, a 70% increase from the 20 lots sold in October. November 2016 sales figures increased 36% from November 2015 when 25 Lake Norman lots sold.
The average sales price increased 210% from $140,650 in October to $436,479 in November. The November 2016 average sales price increased 186% from the November 2015 average sales price which was $152,832.
Average days on the market decreased 15.5% from 213 in October to 180 in November. The November 2015 average days on the market were 157, a 14.6% increase in market time versus the same time period last year.
Currently there are 631 active lot listings for sale in the Lake Norman MLS area, a decrease of 1.4% from November. The average list price is $247,277, up .9% from November’s average list price of $245,138. The average days on the market are 584. 51 Lake Norman area lots are currently under contract, a 21.5% decrease from November.
Stay up to date on the Lake Norman real estate market with our FREE market updates: LakeNormanHomePrices.com
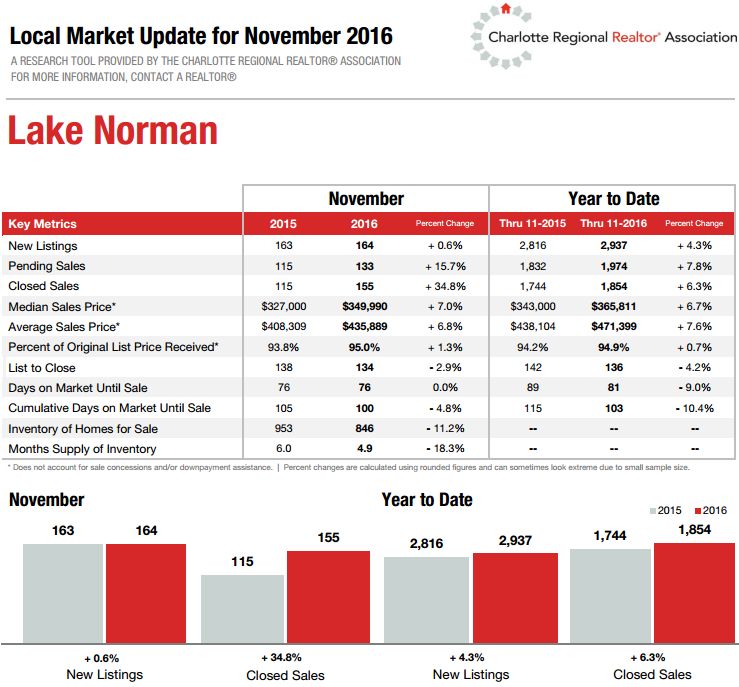
The image below is provided by the local Realtor Association and uses a different map then we do.