Lake Norman Real Estate Market Update October 2016
Lake Norman Homes
In October 135 homes sold in the Lake Norman area, a 27.4% decrease from the 186 homes sold in September. The October 2016 sales figures increased 12.5% from October 2015 when 120 homes sold in the Lake Norman area.
The average sales price increased 2.3% from $478,766 in September to $489,792 in October. The October 2016 average sales price decreased .8% from the October 2015 average sales price which was $493,789.
Average days on the market increased 1.3% from 75 days on the market in September to 76 days on the market in October. The October 2015 average days on the market were 90, a 15.6% decrease in market time.
Currently there are 864 active homes for sale in the Lake Norman MLS area, down 6.9% from October. The average list price is $744,596 down 1.7% from the October average list price of $757,450. The average days on the market are 217. 305 Lake Norman homes are currently under contract, down 2.2% from October.
Stay up to date on the Lake Norman real estate market with our FREE market updates:LakeNormanHomePrices.com
Lake Norman Condos & Townhomes
In October 31 condos/townhomes sold in the Lake Norman area, a 13.9% decrease from the 36 condos or townhomes sold in September. October 2016 sales figures decreased 0% from October 2015 when 31 Lake Norman condos sold.
The average sales price decreased 8.4% from $235,721 in September to $215,834 in October. The October 2016 average sales price increased 5.5% from the October 2015 average sales price which was $204,532.
Average days on the market decreased 6% from 67 in September to 63 in October. The October 2015 average days on the market were 55, a 14.5% increase in market time.
Currently there are 47 active condo/townhome listings for sale in the Lake Norman MLS area, a 6% decrease from the 50 condos for sale in October. The average list price is $286,849, up 3% from October’s average list price of $278,578. The average days on the market are 98. 36 Lake Norman condos/townhomes are currently under contract, a 31% decrease from October.
Stay up to date on the Lake Norman real estate market with our FREE market updates:LakeNormanHomePrices.com
Lake Norman Lots
In October 20 lots sold in the Lake Norman area, a 4.8% decrease from the 21 lots sold in September. October 2016 sales figures decreased 20% from October 2015 when 25 Lake Norman lots sold.
The average sales price decreased 44.8% from $254,956 in September to $140,650 in October. The October 2016 average sales price decreased 35.1% from the October 2015 average sales price which was $216,742.
Average days on the market increased 22.4% from 174 in September to 213 in October. The October 2015 average days on the market were 178, a 19.7% increase in market time versus the same time period last year.
Currently there are 640 active lot listings for sale in the Lake Norman MLS area, a decrease of 3.8% from October. The average list price is $245,138, down 1.5% from October’s average list price of $248,879. The average days on the market are 576. 65 Lake Norman area lots are currently under contract, a 3% decrease from October.
Stay up to date on the Lake Norman real estate market with our FREE market updates: LakeNormanHomePrices.com
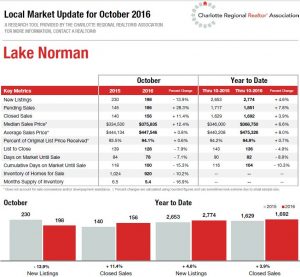
The image below is provided by the local Realtor Association and uses a different map then we do.