Tag: lake norman property
-
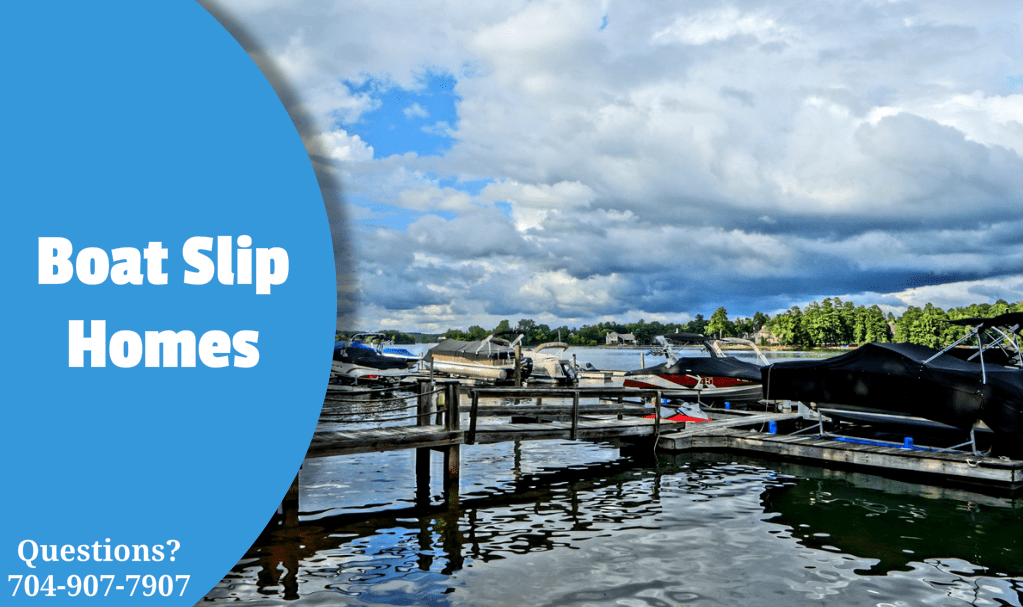
Lake Norman Boat Slip Homes For Sale
Lake Norman waterfront homes for sale. Homes for sale on Lake Norman. Waterfront homes for sale in Mooresville, Cornelius, Denver, Huntersville, Sherrills Ford, Catawba, Terrell, Troutman, Stanley and Statesville.
-

Lake Norman Real Estate Market Update August 2019
Lake Norman Real Estate Update August 2019 Lake Norman Homes In August 2019 208 homes sold in the Lake Norman area, a 4.8% increase from the 198 homes sold in July 2019. The August 2019 sales figures decreased 17.5% from August 2018 when 252 homes sold in the Lake Norman real estate market. The average…
-
Lake Norman Real Estate Market Update July 2019
Lake Norman Real Estate Update July 2019 Lake Norman Homes In July 2019 198 homes sold in the Lake Norman area, a 14% decrease from the 230 homes sold in June 2019. The July 2019 sales figures decreased 8.8% from July 2018 when 217 homes sold in the Lake Norman real estate market. The average…
-
Lake Norman Real Estate Market Update June 2019
Lake Norman Real Estate Update June 2019 Lake Norman Homes In June 2019 230 homes sold in the Lake Norman area, a 5.3% decrease from the 243 homes sold in May 2019. The June 2019 sales figures decreased 12.9% from June 2018 when 264 homes sold in the Lake Norman real estate market. The average…