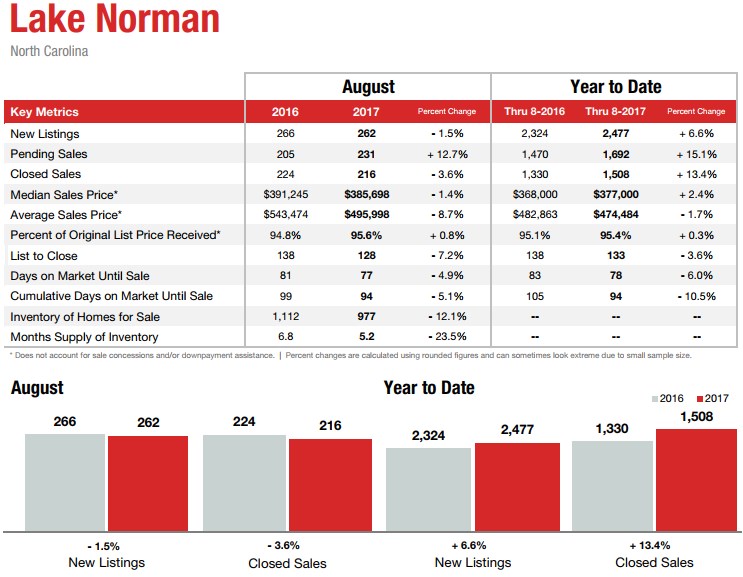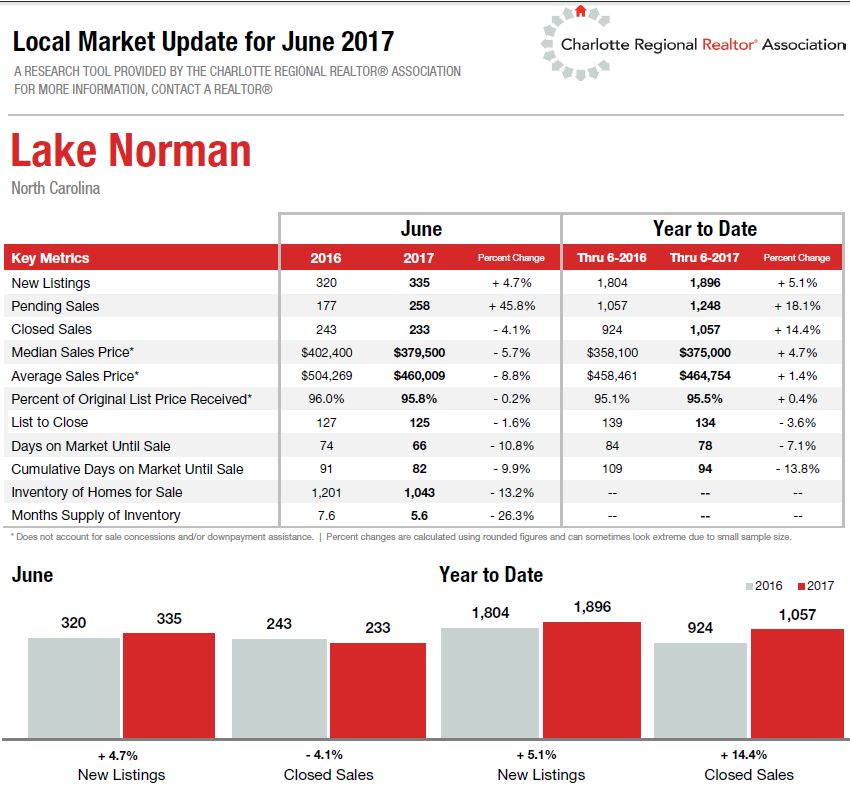
Lake Norman Real Estate Market Update August 2017
Lake Norman Homes
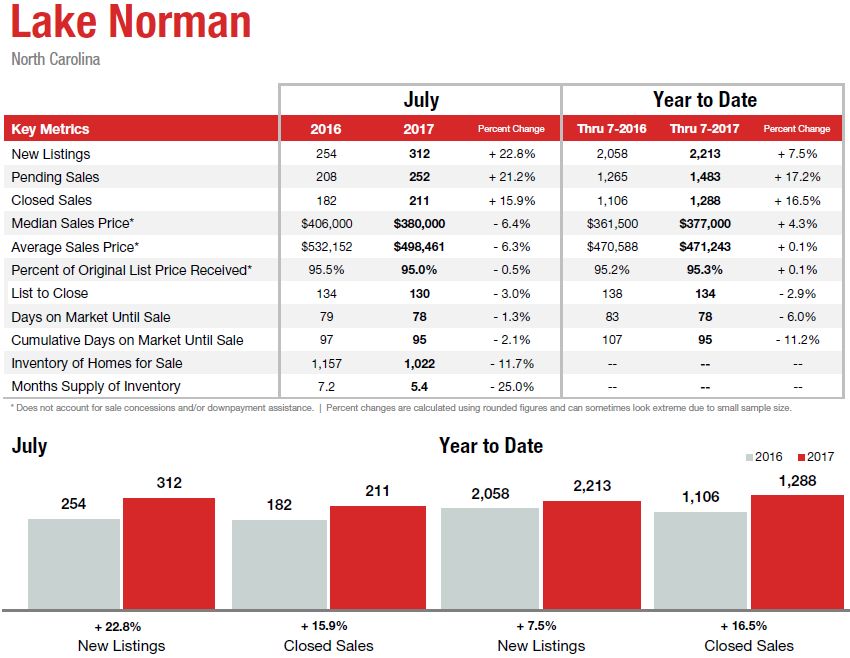
In August 2017 210 homes sold in the Lake Norman area, a 10.5% increase from the 190 homes sold in July. The August 2017 sales figures increased 2.4% from August 2016 when 205 homes sold in the Lake Norman area.
The average sales price decreased 1.1% from $529,266 in July to $523,532 in August. The August 2017 average sales price decreased 9.5% from the August 2016 average sales price which was $578,693.
Average days on the market increased 5.4% from 74 days on the market in July to 78 days on the market in August. The August 2016 average days on the market were 80, an 2.5% decrease in market time from last year.
Currently there are 934 active homes for sale in the Lake Norman MLS area, down 2.9% from August. The average list price is $734,530 down .2% from the August average list price of $736,254. The average days on the market are 170. 363 Lake Norman homes are currently under contract, down 8% from August. Based on this data we are currently in a sellers real estate market, 4.5 months of inventory, in the Lake Norman real estate market.
Stay up to date on the Lake Norman real estate market with our FREE market updates:LakeNormanHomePrices.com
Lake Norman Condos & Townhomes
In August 2017 30 condos/townhomes sold in the Lake Norman area, a 28.6% decrease from the 42 condos or townhomes sold in July 2017. August 2017 sales figures increased 7.1% from August 2016 when 28 Lake Norman condos sold.
The average sales price decreased 7.9% from $240,202 in July to $221,343 in August. The August 2017 average sales price increased 5% from the August 2016 average sales price which was $210,724.
Average days on the market decreased 31% from 58 in July to 40 in August. The August 2016 average days on the market were 63, a 36.5% decrease in market time.
Currently there are 38 active condo/townhome listings for sale in the Lake Norman MLS area, a 15.2% increase from the 33 active condos for sale in August. The average list price is $267,710, down .2% from August’s average list price of $268,185. The average days on the market are 71. 39 Lake Norman condos/townhomes are currently under contract, a 27.8% decrease from August. Based on this months data we are currently in a sellers market, only 1.3 months of inventory, in the Lake Norman condo market.
Stay up to date on the Lake Norman real estate market with our FREE market updates: LakeNormanHomePrices.com
Lake Norman Lots
In August 2017 33 lots sold in the Lake Norman area, a 27% increase from the 26 lots sold in July 2017. August 2017 sales figures increased 37.5% from August 2016 when 24 Lake Norman lots sold.
The average sales price decreased 42.7% from $270,542 in July to $155,061 in August. The August 2017 average sales price increased 3% from the August 2016 average sales price which was $159,826.
Average days on the market decreased .6% from 179 in July to 178 in August. The August 2016 average days on the market were 173, a 2.9% increase in market time versus the same time period last year.
Currently there are 622 active lot listings for sale in the Lake Norman MLS area, an increase of 3.3% from August. The average list price is $270,181, down .2% from August’s average list price of $270,726. The average days on the market are 527. 57 Lake Norman area lots are currently under contract, a 36% decrease from August. Based on this data, 18.8 months of inventory, we are in a buyers market for Lake Norman lots & land.
Stay up to date on the Lake Norman real estate market with our FREE market updates: LakeNormanHomePrices.com
The image below is provided by the local Realtor Association and uses a different map then we do so the stats will differ. Click image for more legible picture.