
Lake Norman Real Estate Market Update March 2017
Lake Norman Homes
In March 2017 184 homes sold in the Lake Norman area, a 187.5% increase from the 64 homes sold in February and the highest March total on record. The March 2017 sales figures increased 64.3% from March 2016 when 112 homes sold in the Lake Norman area.
The average sales price increased 11.5% from $452,538 in February to $504,410 in March. The March 2017 average sales price increased 8.8% from the March 2016 average sales price which was $463,498.
Average days on the market increased 4.4% from 90 days on the market in February to 94 days on the market in March. The March 2016 average days on the market were 86, a 9.3% increase in market time from last year.
Currently there are 908 active homes for sale in the Lake Norman MLS area, up 3.2% from March. The average list price is $764,373 up 2% from the March average list price of $749,159. The average days on the market are 163. 411 Lake Norman homes are currently under contract, up 10.5% from March. Based on this data we are currently in a sellers market, 2.7 months of inventory, in the Lake Norman real estate market.
Stay up to date on the Lake Norman real estate market with our FREE market updates:LakeNormanHomePrices.com
Lake Norman Condos & Townhomes
In March 2017 43 condos/townhomes sold in the Lake Norman area, a 95.5% increase from the 22 condos or townhomes sold in February 2017 and tied the highest monthly sales total on record. March 2017 sales figures increased 48.3% from March 2016 when 29 Lake Norman condos sold.
The average sales price decreased 7.8% from $267,967 in February to $246,985 in March. The March 2017 average sales price increased 12.9% from the March 2016 average sales price which was $218,796.
Average days on the market increased 32% from 50 in February to 66 in March. The March 2016 average days on the market were 73, a 9.6% decrease in market time.
Currently there are 38 active condo/townhome listings for sale in the Lake Norman MLS area, an 11.8% increase from the 34 active condos for sale in March. The average list price is $283,688, up 4.4% from March’s average list price of $271,633. The average days on the market are 63. 38 Lake Norman condos/townhomes are currently under contract, a 15.5% decrease from March. Based on this months data we are currently in a sellers market, only .9 months of inventory, in the Lake Norman condo market.
Stay up to date on the Lake Norman real estate market with our FREE market updates:LakeNormanHomePrices.com
Lake Norman Lots
In March 2017 26 lots sold in the Lake Norman area, an 18.8% decrease from the 32 lots sold in February 2017. March 2017 sales figures decreased 18.8% from March 2016 when 32 Lake Norman lots sold.
The average sales price decreased 31.5% from $205,335 in February to $140,565 in March. The March 2017 average sales price decreased 3.3% from the March 2016 average sales price which was $145,375.
Average days on the market increased 5.8% from 172 in February to 182 in March. The March 2016 average days on the market were 182, a 0% increase in market time versus the same time period last year.
Currently there are 630 active lot listings for sale in the Lake Norman MLS area, an increase of 3.3% from March. The average list price is $279,770, up 2.8% from March’s average list price of $272,138. The average days on the market are 528. 72 Lake Norman area lots are currently under contract, a 14.3% increase from March. Based on this data, 24.2 months of inventory, we are in a buyers market for Lake Norman lots & land.
Stay up to date on the Lake Norman real estate market with our FREE market updates: LakeNormanHomePrices.com
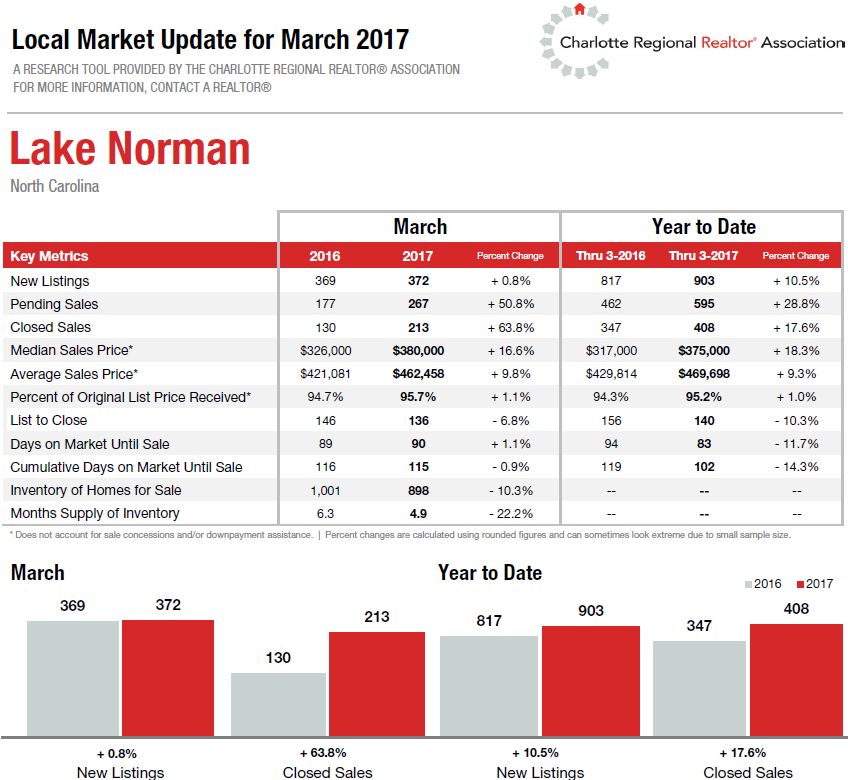
The image below is provided by the local Realtor Association and uses a different map then we do.
Click image for more legible picture.
Leave a Reply
You must be logged in to post a comment.